Climate change
Global CO₂ emissions
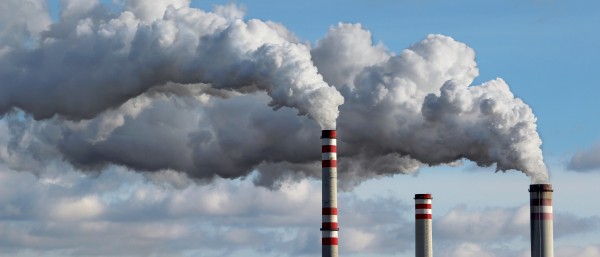
Despite the Paris Agreement, CO₂ emissions continue to rise in a number of countries. They are the primary cause of global warming. Industrial countries and emerging economies are the main sources of emissions. Our updated interactive world map shows the CO₂ emissions of each country and how they have developed since 1990 – in a single click.
In 1997, the Kyoto Protocol was ratified by the majority of the members of the United Nations. It thus became the first treaty to set internationally binding targets for reducing global emissions of greenhouse gases. The Paris Agreement reinforced commitment to these targets in 2015. The signatories agreed to limit global warming to well below 2 °C. However, CO₂ emissions continue to increase in many countries. This is evidenced by the most recent international figures from the European Commission's EDGAR database (Emissions Database for Global Atmospheric Research), which include emissions up to 2017. The figures from 2018 are not yet available.
Between 1990 and 2017, the total global emissions increase was 63.5 percent. The front-runner in 2017 was China, followed by the USA, India and Russia. Germany is sixth in the ranking, but its development shows a decline in CO₂ emissions of just under 22 per cent – whereas China, on the other hand, recorded an increase of 353.8 per cent.
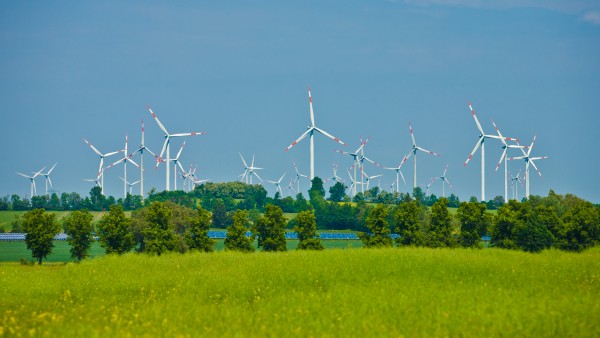
However, some countries have already stopped their negative trend, including most notably Morocco, where the largest solar power plant complex in the world heralded the beginning of the energy transition with a total output of 580 megawatts. Since it became fully operational at the end of 2018, the country's CO₂ emissions have been in line with the target stipulated in the Paris Agenda. However, this positive development can only be seen on the world map once the 2019 figures for the countries' CO₂ emissions have been included in the calculations of the European Commission's database. CO₂ emissions in the EU 28 have fallen over the past two decades. Still, per capita emissions of CO₂ in the EU Member States are still above the global average.
The interactive map shows three values per country: total CO2 emissions (in kilotonnes), changes in total emissions between 1990 and 2017, and CO2 emissions per capita (in tonnes).
4,9 t
in tons; 2015Sources: European Commission, own calculations; Data refer to emissions from fossil fuels and cement production
Published on KfW Stories: Tuesday, 10 October 2017
Data protection principles
If you click on one of the following icons, your data will be sent to the corresponding social network.
Privacy information