Interactive world map
Global green electricity
Renewable energy sources play a significant role in mitigating climate change. With a mere click, our updated interactive world map shows the green electricity each country generates from solar power, wind energy and hydropower.
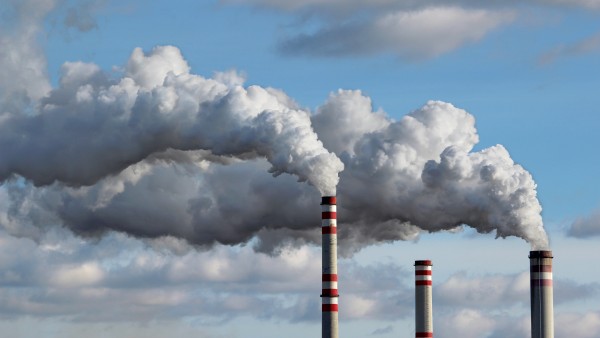
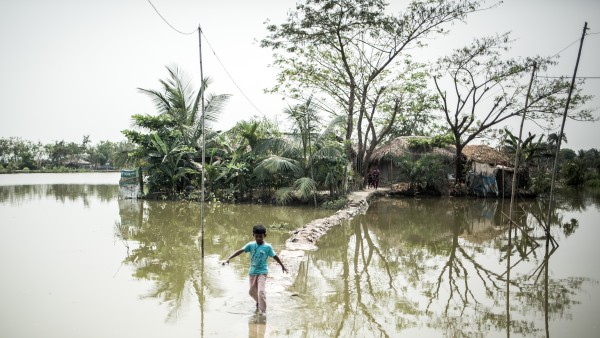
Combating climate change caused by human beings is the overarching goal of the Paris Agreement. The signatories agreed to limit global warming to well below two degrees Celsius above pre-industrial levels. This target can only be reached if greenhouse gas emissions are gradually reduced.
In addition to deforestation, agriculture and cattle farming, the combustion of fossil energy resources such as oil and coal increases the carbon dioxide (CO₂) in the atmosphere. Renewable sources such as solar power, wind energy and hydropower provide energy without increasing these levels. Current figures indicate that the share of energy consumption covered by renewable energy sources is growing worldwide – in Germany, it increased from around six per cent in 2000 to around 38 per cent in 2018.
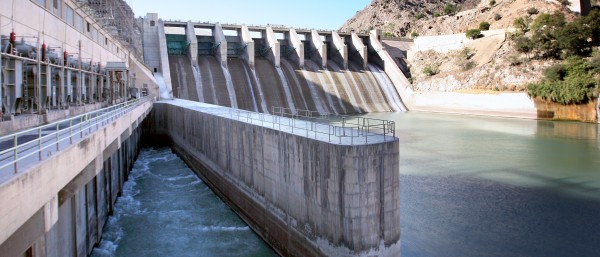
The interactive world map shows which energy sources are used to produce green energy in the individual countries. It shows the electricity production from solar power, wind energy and hydropower in gigawatt hours (one gigawatt hour is equivalent to one million kilowatt hours). Hydropower makes up the largest share worldwide. In Germany however, green electricity is mainly produced using wind energy; In China and the United States, the main source is hydropower. The world map is based on the International Energy Agency's global data from 2017.
190.118 GWh
in Gigawatt hours per yearSources: World Bank, International Energy Agency, own calculations
Published on KfW Stories: 6 November 2017, last updated: 2 December 2019.
Data protection principles
If you click on one of the following icons, your data will be sent to the corresponding social network.
Privacy information